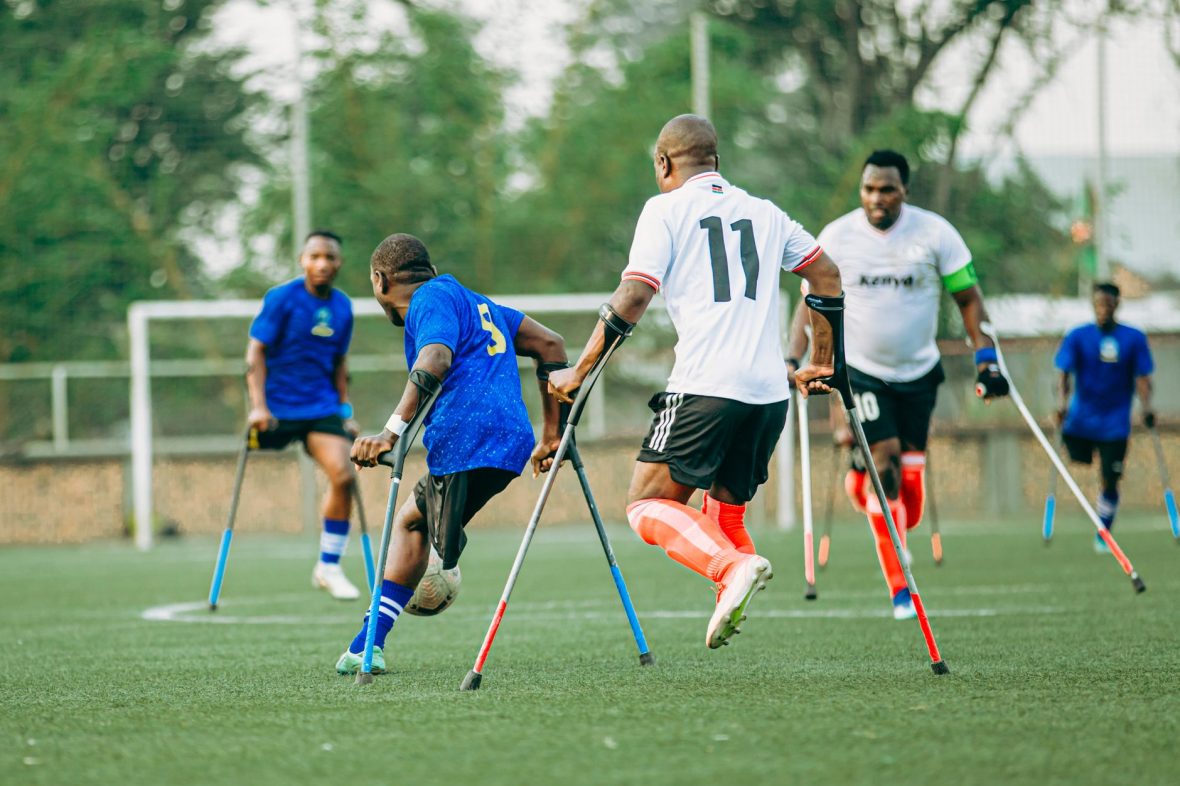
The chance creates the possibility; the finish decides what the goalkeeper must stop.
A low cutback reaches a striker near the penalty spot. One attempt is struck firmly but straight at the goalkeeper; another is guided inside the far post. Before contact, the opportunities are almost identical, so ordinary expected goals (xG) may value them equally. The scoreline records only that one went in.
Top Free Bets for October
BetUS
200% up to $1,000
18+. Full T&C's apply. Sports bonus: 100% match up to $500. Casino bonus: 100% match up to $500. Enter promo code NEW200 at deposit and get up to a $1000 bonus. Valid on your first three (3) deposits. Available for all deposit methods. Minimum deposit of $50.
18+. Full terms apply. The Bet Back Bonus is available for new customers on first-time deposits of $50 or more. To redeem, select the offer in the cashier while completing your first deposit. Make your pick(s) in the Sportsbook and then select ‘Opt In to Use Your Bonus’. A Bet Back Bonus pop-up will display, select ‘Claim’ and then enter the risk amount to place your bet. If it wins, you keep your profits. If it loses, get 100% of your risk refunded as Free Play with only 1-time rollover. Free Play can then be used to place bets in the Sportsbook and earn cash. Additional T&Cs apply, please visit MyBookie to access the Help Center or contact Live Chat for more details.
18+. Full T&C's apply. This promotion is available only to new accounts in North America. Freeplay amount must be wagered five times (5x rollover) before it becomes eligible for withdrawal. Only prematch (sportsbook) bets count toward the 5x rollover requirement. Each person may claim only one bonus. If a customer creates multiple accounts to exploit this promotion, bet105 will mark all related accounts as ineligible and reclaim the funds. If a client receives more than two free bets without making a deposit, any winnings from those bets will be forfeited. This promotion applies only to the initial deposit or if specifically assigned by bet105.
18+. Full terms apply. New BUSR members only. Minimum deposit of $50 required per qualifying deposits. Codes 300SB1, 300SB2, and 300SB3 must be entered at the time of each corresponding deposit.
Each code is valid one time only. Each bonus code must be claimed at least 24 hours apart. Only one promo code may be applied per deposit. A 20x rollover requirement applies to the combined total of your initial deposit and bonus before any withdrawal can be made. Redeemable in the Sportsbook only. BUSR management reserves the right to modify, suspend, or cancel this promotion at any time. Redeem each promo code in the cashier to get your bonus. Must be 18 or older. Please gamble responsibly. General House Rules Apply.
18+. Full terms apply. 100% up to $500 Bonus. Valid for non-crypto payment methods only. Minimum deposit amount $50. This offer is not available to customers from Canada or Mexico. The bonus code must be redeemed immediately after the deposit and before a wager has been placed. The sum of the deposit and the bonus are subject to rollover requirements of 12x at min. odds of -200 (1.5) before a new code can be redeemed. Max. $500 of each bet count towards the rollover requirements. Only bets placed on options that take place count towards the rollover requirements. Wagers on Horse Racing and Boosted Odds do not count towards the rollover requirements. All general Everygame Sportsbook rules apply.
21+. Full T&C's apply. Bonus: 35% of qualifying deposit, up to $105. Rollover: 8× (only sports action counts towards the rollover) deposit + bonus. Expiry: 7 days after credit. Hold period: 2 weeks. Payouts allowed only after rollover and hold period are completed. Example: Deposit $200 → Receive $50 Sports Free Play. Sports Free Play Rules: see the BetAnything General Reward Rules for eligible sports, wager types, odds, and rollover rules.
18+. Full T&C's apply. This bonus can only be redeemed on your first deposit. Rollover is 5x Sports/5x Horses/30x Casino on both the initial deposit and the bonus amount. Rollover in our Sportsbook, for winning wagers, will be determined by the lesser of your risk or win amount at the time of wager settlement; for losing wagers your risk amount will be credited to your rollover contribution. Bonus funds cannot be used for play on Live Dealer games. Live Dealer play does not count toward meeting Casino rollover requirements for withdrawal. If a withdrawal is made before the bonus terms are met, all bonus funds as well as any money earned by wagering the bonus will be forfeited.
Post-shot xG adds the missing layer. For an on-target effort, it estimates the chance of scoring after placement and trajectory are known. The central shot may receive a low value despite coming from a strong position, while the corner-bound finish may rate highly. Comparing pre-shot xG with post-shot xG therefore helps separate the quality of the opportunity from the quality of the execution—and can also show when a goalkeeper prevented an especially difficult shot.
Key terms
How to read a PSxG value
Post-shot expected goals (PSxG)
PSxG estimates the probability that an on-target shot becomes a goal after the model knows its placement and trajectory. It builds on the basic idea behind expected goals by considering where the ball is actually heading, not only where it was struck.
Decimal value
A PSxG of 0.35 means that comparable on-target attempts would be expected to score about 35% of the time. A value of 0.80 represents an 80% estimated chance.
Probability, not prediction
The number does not declare whether one particular shot will score. A 0.80 attempt can still be saved, while a 0.10 attempt can beat the goalkeeper.
Not a fraction of a goal
A shot worth 0.35 PSxG does not produce 0.35 of a goal. The decimal is a probability that can be added across many shots to assess finishing or goalkeeping over time.
Before and after
xG and PSxG answer different questions
One rates the opportunity; the other rates the shot that followed.
Expected goals (xG) asks how likely a chance was to become a goal before the ball was struck. It describes the quality of the opportunity: a central shot from six yards will usually carry more xG than an attempt from a tight angle outside the box.
Typical xG inputs include:
Shot location and angle
Distance from goal
Body part used
Type of assist or preceding action
Open play, set piece, or penalty
Defensive pressure, where the data provider records it
Post-shot expected goals (PSxG) asks how likely the resulting on-target shot was to beat the goalkeeper. Its inputs commonly include where the ball was heading within the goal, along with shot speed, height, trajectory, and sometimes the goalkeeper’s position. Exact features vary between providers.
Situation
xG interpretation
PSxG interpretation
Close-range shot sent straight at the keeper
Strong chance
Relatively low danger
Difficult shot driven into a corner
Weak chance
Relatively high danger
Good chance missed off target
Still records chance quality
Usually no PSxG value
That last distinction matters: PSxG is generally calculated only for shots on target, while xG can cover shots that miss or are blocked. Provider definitions can differ, so comparisons are safest within the same dataset.
In short, xG helps judge the chance created; PSxG helps judge the danger produced after the finish. The gap between them can offer clues about shot execution, but a single attempt says little about lasting finishing ability.
From strike to probability
How an on-target shot receives its PSxG
01
Confirm the shot qualifies
The event feed identifies an attempt that reaches the goal frame: either it is saved or it goes in. This usually defines the pool eligible for PSxG.
02
Record the ball’s path
Tracking or event data describes the ball after contact, commonly including where it crosses the goal line and, in richer models, its speed or movement. Inputs differ by provider.
03
Turn trajectory into features
Those measurements capture distance from the corners, height, centrality, pace, and sometimes the goalkeeper’s position. A hard shot near a corner usually looks harder to stop.
04
Compare similar historical attempts
The model compares that feature combination with similar past shots and their outcomes. If 38 percent of comparable attempts became goals, the new attempt may receive a PSxG near 0.38.
05
Understand why values may be missing
An off-target shot has no goalmouth destination to evaluate, while a blocked shot may never reveal its intended trajectory. Many feeds therefore leave PSxG blank for both rather than assigning zero; some providers use different eligibility rules or estimation methods.
Worked example
Three shots, three versions of the match
Opportunity, execution, and outcome need not point in the same direction.
Consider three attempts from the same team. The figures below are illustrative, but they show how each layer adds a different piece of information.
Attempt
xG
PSxG
Outcome
Close-range chance, struck low and centrally
0.60
0.30
Goal
Tighter-angle chance, driven toward the top corner
0.12
0.65
Saved
Long-range effort that misses the target
0.08
—
No goal
The first shot begins as an excellent opportunity. Its central placement makes it less threatening after contact, yet it still goes in—perhaps through the goalkeeper’s legs or after a mistake. The goal does not prove that the finish was outstanding; it records only the final result.
The second attempt comes from a less promising position, so its xG is modest. Once struck accurately toward the corner, however, it becomes a difficult save and receives a much higher PSxG value. A goalkeeper can still stop it: high PSxG means dangerous, not inevitable.
The third effort contributes to xG because a shot was attempted, but it receives no PSxG in models restricted to shots on target. That distinction is central to understanding why xG and the scoreline can disagree.
Across these attempts, the team scores once, records 0.80 xG, and produces 0.95 PSxG from its two on-target shots. The scoreline says one chance was converted; xG says the team created one major opening plus two lesser ones; PSxG says the on-target execution was dangerous overall. None is the single “correct” story—they describe different stages of the same attacks.
Reading the gap
What the xG-to-PSxG gap reveals
The difference can suggest better or worse execution, but context determines how much it means.
Subtracting xG from PSxG offers a rough view of what happened at contact. When PSxG exceeds xG, the shot was made more dangerous through placement, trajectory, or clean ball striking. A lower PSxG suggests the opportunity lost value on its way toward goal—perhaps because the effort was too central, weak, or otherwise comfortable to save.
That difference can make a finish informative without making it definitive. Turning a 0.10 xG opening into a 0.45 PSxG shot indicates excellent execution on that attempt; it does not prove the player is an elite finisher. One spectacular strike can dominate a small sample, while several mishits can distort it in the opposite direction.
Sample size: hundreds of shots carry more weight than a short scoring run.
Role and selection: poachers, set-piece takers, and frequent long-range shooters face different shot profiles.
Repeatable technique: composure, preferred-foot use, and an ability to find corners may persist more reliably than occasional wonder goals.
Model design: providers use different inputs and may value placement, power, headers, or deflections differently.
The gap is therefore best treated as evidence of execution, not a standalone finishing grade. Video, shot maps, and multiple seasons can help distinguish a stable skill from favorable variance.
Turning PSxG into a goalkeeper measure
For a goalkeeper, PSxG faced is the sum of the post-shot values of all eligible shots on target faced. Comparing that total with goals conceded gives a simple estimate of shot-stopping performance:
Goals prevented = PSxG faced − goals conceded
If a keeper faces 12.4 PSxG and concedes 10 goals, the result is +2.4 goals prevented. Conceding fewer goals than the model expects suggests above-average saving; conceding more produces a negative figure. Some sources reverse the subtraction or report the number per 90 minutes, so the label and sign convention should always be checked.
This comparison improves on save percentage because it recognizes that shots are not equally difficult. Stopping a close-range effort headed for the corner receives more credit than collecting a weak attempt near the center of goal.
Still, goals prevented is an estimate, not a complete verdict. Results can be influenced by small samples, model differences, defensive pressure, screens, deflections, rebound sequences, and whether the goalkeeper’s starting position made the eventual save easier or harder. A few unusually difficult shots can move the total sharply.
PSxG also evaluates only the shots that reach its model. It does not adequately capture:
claiming crosses and controlling the penalty area;
sweeping behind the defensive line;
distribution and decision-making in possession;
communication and defensive organization;
actions that prevent a shot from occurring;
rebound control that changes the next phase.
It is therefore strongest as a shot-stopping indicator, especially over substantial samples, rather than an all-purpose goalkeeper ranking.
Reality check
Three PSxG myths that distort interpretation
Myth
PSxG is a universal statistic with one standard formula.
Fact
The number depends on the data provider and model version.
Why it matters
Shot eligibility, training data, and feature definitions differ, so identical attempts can receive different ratings.
Myth
Every PSxG model uses only where the ball crosses the goalmouth.
Fact
Inputs may also include height, speed, angle, or trajectory.
Why it matters
The exact mix varies; PSxG does not automatically capture intention, disguise, or every aspect of difficulty.
Myth
A small gap or a hot five-match spell proves superior finishing or goalkeeping.
Fact
Minor differences and short runs are usually too noisy for firm conclusions.
Why it matters
A few rebounds, difficult saves, or unusual shots can swing the total; larger samples and role context matter.
Data note
Live numbers can move
Live xG apps showing in-match data may display provisional values. Providers can reclassify shots, correct tracking, or rerun models after review, so post-match totals may differ.
Practical checklist
A disciplined way to read PSxG
Start with xG
Establish how favorable the opportunity was before the ball was struck.
Check PSxG
Assess the danger created by the shot’s placement and trajectory.
Compare the values
PSxG above xG suggests execution increased the threat; a lower value suggests it reduced it.
Add match context
Consider shot volume, angle, pressure, body part, player role, and the provider’s model.
Wait for a useful sample
One attempt can describe an event, but it cannot establish finishing or goalkeeping ability.
Conclusion
xG describes the chance offered; PSxG describes the danger produced by the finish. Read together, they separate opportunity quality from execution without treating either number as a complete verdict.
Top Free Bets for October
BetUS
200% up to $1,000
18+. Full T&C's apply. Sports bonus: 100% match up to $500. Casino bonus: 100% match up to $500. Enter promo code NEW200 at deposit and get up to a $1000 bonus. Valid on your first three (3) deposits. Available for all deposit methods. Minimum deposit of $50.
18+. Full terms apply. The Bet Back Bonus is available for new customers on first-time deposits of $50 or more. To redeem, select the offer in the cashier while completing your first deposit. Make your pick(s) in the Sportsbook and then select ‘Opt In to Use Your Bonus’. A Bet Back Bonus pop-up will display, select ‘Claim’ and then enter the risk amount to place your bet. If it wins, you keep your profits. If it loses, get 100% of your risk refunded as Free Play with only 1-time rollover. Free Play can then be used to place bets in the Sportsbook and earn cash. Additional T&Cs apply, please visit MyBookie to access the Help Center or contact Live Chat for more details.
18+. Full T&C's apply. This promotion is available only to new accounts in North America. Freeplay amount must be wagered five times (5x rollover) before it becomes eligible for withdrawal. Only prematch (sportsbook) bets count toward the 5x rollover requirement. Each person may claim only one bonus. If a customer creates multiple accounts to exploit this promotion, bet105 will mark all related accounts as ineligible and reclaim the funds. If a client receives more than two free bets without making a deposit, any winnings from those bets will be forfeited. This promotion applies only to the initial deposit or if specifically assigned by bet105.
18+. Full terms apply. New BUSR members only. Minimum deposit of $50 required per qualifying deposits. Codes 300SB1, 300SB2, and 300SB3 must be entered at the time of each corresponding deposit.
Each code is valid one time only. Each bonus code must be claimed at least 24 hours apart. Only one promo code may be applied per deposit. A 20x rollover requirement applies to the combined total of your initial deposit and bonus before any withdrawal can be made. Redeemable in the Sportsbook only. BUSR management reserves the right to modify, suspend, or cancel this promotion at any time. Redeem each promo code in the cashier to get your bonus. Must be 18 or older. Please gamble responsibly. General House Rules Apply.
18+. Full terms apply. 100% up to $500 Bonus. Valid for non-crypto payment methods only. Minimum deposit amount $50. This offer is not available to customers from Canada or Mexico. The bonus code must be redeemed immediately after the deposit and before a wager has been placed. The sum of the deposit and the bonus are subject to rollover requirements of 12x at min. odds of -200 (1.5) before a new code can be redeemed. Max. $500 of each bet count towards the rollover requirements. Only bets placed on options that take place count towards the rollover requirements. Wagers on Horse Racing and Boosted Odds do not count towards the rollover requirements. All general Everygame Sportsbook rules apply.
21+. Full T&C's apply. Bonus: 35% of qualifying deposit, up to $105. Rollover: 8× (only sports action counts towards the rollover) deposit + bonus. Expiry: 7 days after credit. Hold period: 2 weeks. Payouts allowed only after rollover and hold period are completed. Example: Deposit $200 → Receive $50 Sports Free Play. Sports Free Play Rules: see the BetAnything General Reward Rules for eligible sports, wager types, odds, and rollover rules.
18+. Full T&C's apply. This bonus can only be redeemed on your first deposit. Rollover is 5x Sports/5x Horses/30x Casino on both the initial deposit and the bonus amount. Rollover in our Sportsbook, for winning wagers, will be determined by the lesser of your risk or win amount at the time of wager settlement; for losing wagers your risk amount will be credited to your rollover contribution. Bonus funds cannot be used for play on Live Dealer games. Live Dealer play does not count toward meeting Casino rollover requirements for withdrawal. If a withdrawal is made before the bonus terms are met, all bonus funds as well as any money earned by wagering the bonus will be forfeited.
Hi I'm Andy and I love to report on the latest football scores and Tables. I also like to have a bet on the football and occasionaly on the horses. On this website I have new bookmaker offers listed that will give you free bets and bonuses to help you beat the bookies. Enjoy your stay.