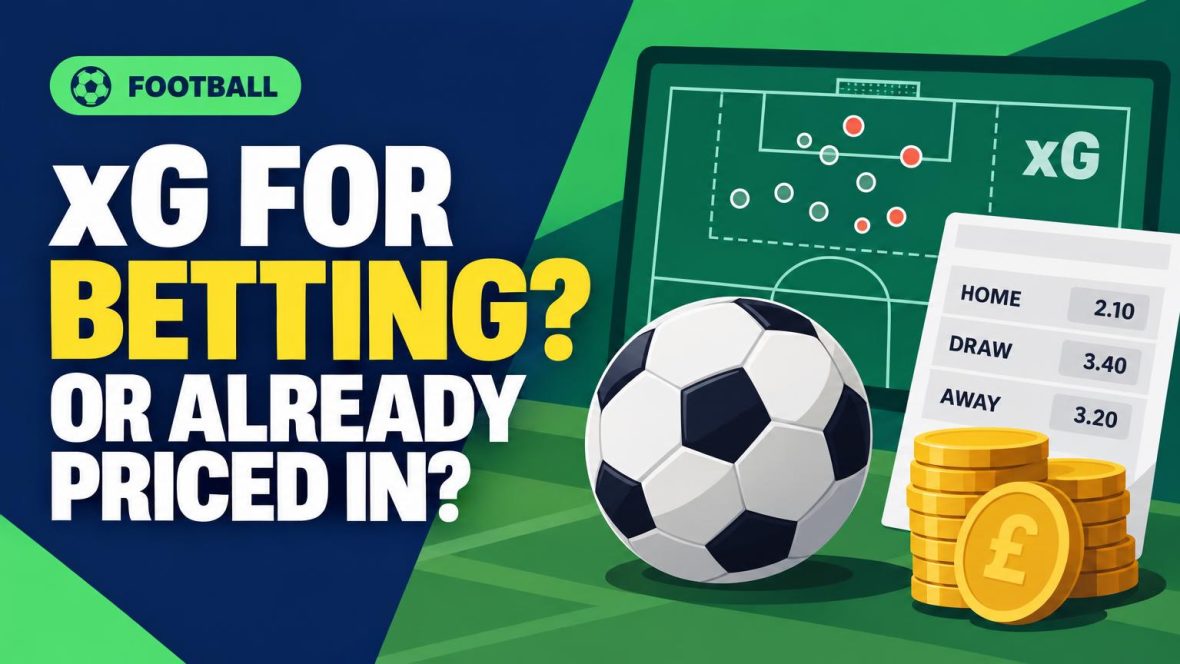
A team loses 1–0 despite creating chances worth 2.1 expected goals (xG), while its opponent manages just 0.6. Its odds for the next match drift, and the rebound looks tempting. The xG figures suggest the team played better than the scoreline implies, but they do not say how likely it is to win next time. The opponent, injuries and home advantage may all change.
Top Free Bets for October
BetUS
200% up to $1,000
18+. Full T&C's apply. Sports bonus: 100% match up to $500. Casino bonus: 100% match up to $500. Enter promo code NEW200 at deposit and get up to a $1000 bonus. Valid on your first three (3) deposits. Available for all deposit methods. Minimum deposit of $50.
18+. Full terms apply. The Bet Back Bonus is available for new customers on first-time deposits of $50 or more. To redeem, select the offer in the cashier while completing your first deposit. Make your pick(s) in the Sportsbook and then select ‘Opt In to Use Your Bonus’. A Bet Back Bonus pop-up will display, select ‘Claim’ and then enter the risk amount to place your bet. If it wins, you keep your profits. If it loses, get 100% of your risk refunded as Free Play with only 1-time rollover. Free Play can then be used to place bets in the Sportsbook and earn cash. Additional T&Cs apply, please visit MyBookie to access the Help Center or contact Live Chat for more details.
18+. Full T&C's apply. This promotion is available only to new accounts in North America. Freeplay amount must be wagered five times (5x rollover) before it becomes eligible for withdrawal. Only prematch (sportsbook) bets count toward the 5x rollover requirement. Each person may claim only one bonus. If a customer creates multiple accounts to exploit this promotion, bet105 will mark all related accounts as ineligible and reclaim the funds. If a client receives more than two free bets without making a deposit, any winnings from those bets will be forfeited. This promotion applies only to the initial deposit or if specifically assigned by bet105.
18+. Full terms apply. New BUSR members only. Minimum deposit of $50 required per qualifying deposits. Codes 300SB1, 300SB2, and 300SB3 must be entered at the time of each corresponding deposit.
Each code is valid one time only. Each bonus code must be claimed at least 24 hours apart. Only one promo code may be applied per deposit. A 20x rollover requirement applies to the combined total of your initial deposit and bonus before any withdrawal can be made. Redeemable in the Sportsbook only. BUSR management reserves the right to modify, suspend, or cancel this promotion at any time. Redeem each promo code in the cashier to get your bonus. Must be 18 or older. Please gamble responsibly. General House Rules Apply.
18+. Full terms apply. 100% up to $500 Bonus. Valid for non-crypto payment methods only. Minimum deposit amount $50. This offer is not available to customers from Canada or Mexico. The bonus code must be redeemed immediately after the deposit and before a wager has been placed. The sum of the deposit and the bonus are subject to rollover requirements of 12x at min. odds of -200 (1.5) before a new code can be redeemed. Max. $500 of each bet count towards the rollover requirements. Only bets placed on options that take place count towards the rollover requirements. Wagers on Horse Racing and Boosted Odds do not count towards the rollover requirements. All general Everygame Sportsbook rules apply.
21+. Full T&C's apply. Bonus: 35% of qualifying deposit, up to $105. Rollover: 8× (only sports action counts towards the rollover) deposit + bonus. Expiry: 7 days after credit. Hold period: 2 weeks. Payouts allowed only after rollover and hold period are completed. Example: Deposit $200 → Receive $50 Sports Free Play. Sports Free Play Rules: see the BetAnything General Reward Rules for eligible sports, wager types, odds, and rollover rules.
18+. Full T&C's apply. This bonus can only be redeemed on your first deposit. Rollover is 5x Sports/5x Horses/30x Casino on both the initial deposit and the bonus amount. Rollover in our Sportsbook, for winning wagers, will be determined by the lesser of your risk or win amount at the time of wager settlement; for losing wagers your risk amount will be credited to your rollover contribution. Bonus funds cannot be used for play on Live Dealer games. Live Dealer play does not count toward meeting Casino rollover requirements for withdrawal. If a withdrawal is made before the bonus terms are met, all bonus funds as well as any money earned by wagering the bonus will be forfeited.
The price is the test. Bookmakers and other bettors can see the same shot data, so the apparent bad luck may already be reflected in the odds. A bet only becomes interesting if a realistic estimate of the team's chances is higher than the probability implied by the available price, allowing for the bookmaker's margin.
What xG measures—and what it misses
Expected goals, or xG, estimates the quality of scoring chances a team created. A shot from close range with a clear view of goal receives a higher value than a speculative effort from distance. Those shot values are added together; a team with 2.0 xG created chances that, on average, would produce about two goals. For a closer look at the calculation, see how expected goals works.
That makes xG useful when the score alone gives a misleading impression. A team that loses 1–0 after creating several good chances may have played better in attack than the result suggests. Across several matches, xG can also help distinguish a sustained pattern of chance creation from a brief run of fortunate finishing.
Past chance quality is not a betting probability, though. A 2.0 xG total does not mean the team had a particular percentage chance of winning, nor does it predict two goals next time. The next match may bring a different striker, a defensive opponent or an early red card. Turning xG into a bet still requires a view of those conditions—and a comparison with the price offered.
How xG gets into the odds
Bookmakers do not need to wait for a widely shared xG chart to notice that a team has created good chances. Shot-quality data can feed pre-match ratings alongside injuries, rest and home advantage. Opening odds may already reflect strong underlying performances that recent results hide.
After prices are posted, public xG figures can influence betting and move the market. If a team loses 1–0 despite creating the better chances, bettors may back it next time, shortening its odds. A move from 2.40 to 2.20 does not prove xG caused the change; team news or other betting activity could also explain it.
Using xG is not the same as pricing every xG-informed view correctly. Models differ, and the same shot-quality record can be weighted differently for the next fixture. An edge requires a defensible estimate of the outcome that differs from the available price—not simply a high xG total. At decimal odds of 2.20, the break-even win probability is about 45.5% before commission. An estimate above that threshold is useful only if its assumptions and uncertainty hold up.
Use xG gaps to ask better questions
Three wins from few good chances can make a side look stronger than its shot data suggests. A team creating clear chances but failing to score may be healthier than its results imply. Neither pattern guarantees goals will “catch up”; xG averages obscure who took the shots and how chances arose.
Check what changed
Before acting on a goals–xG gap, compare recent games with earlier ones:
Personnel: Was the first-choice striker missing or a key defender injured? Old shot patterns may not fit the current lineup.
Tactics: Did a new formation or pressing approach change the chances created? One unusually open match is weak evidence of a trend.
Opponents: Did the run come against depleted or weaker teams? Similar numbers against tougher opponents would be more convincing.
A flattering win can also rest on an exceptional goalkeeping display rather than solid defending. The question is whether the lineup, approach and level of opposition behind the gap are likely to recur. If not, the discrepancy describes the past better than the next match.
Estimating a price
From xG figures to a match probability
01
Start with rates, not season totals
Convert each team’s xG for and xG conceded into per-match rates. Check the sample: a run against unusually strong opponents may need more caution than the raw averages suggest.
02
Estimate each side’s goals
Blend the home side’s attacking rate with the away side’s defensive rate, then do the reverse for the visitor. The league average offers a useful reference point so that two unusually high or low rates are not taken at face value.
03
Adjust for this fixture
Home advantage, a missing striker or a changed defensive setup may shift those estimates. Keep adjustments modest and avoid counting the same effect twice if it is already reflected in the data.
04
Convert goals into a market probability
If the estimated goal rates are 1.5 and 1.2, their combined rate is 2.7. A basic Poisson calculation puts the chance of Over 2.5 goals at about 51%, assuming goals follow that model.
05
Compare with the quoted odds
Decimal odds of 1.90 imply about 53% before allowing for the bookmaker’s margin. That gap is not automatically an edge: the rates, fixture adjustments and probability model are all estimates, not facts.
One estimate, two very different bets
Suppose an xG-based model puts the chance of Over 2.5 goals at 55%. That number means little for betting until it is compared with a price. Decimal odds of 1.75 imply a break-even probability of about 57.1% (1 ÷ 1.75). At those odds, a 55% estimate is too low: a one-unit bet would lose about 0.038 units on average if the estimate is right.
Now suppose another bookmaker offers 1.95 on the same market. Its break-even probability is about 51.3% (1 ÷ 1.95). The 55% estimate clears that hurdle, suggesting an expected gain of about 0.073 units per unit staked. The match prediction has not changed; only the price has.
That is a reason to investigate, not proof of an edge. A small change in the model’s goal estimates, team news or the assumed relationship between the teams’ scoring rates could move the Over probability. The calculation is useful because it makes the decision testable: reject 1.75, then check whether the 55% estimate is sturdy enough to consider 1.95.
Check the cutoff
At a 55% probability, fair decimal odds are about 1.82 (1 ÷ 0.55). A price above that leaves room for an edge only if the probability estimate holds up.
When an xG edge fades
A five-match xG average can look persuasive until the fixtures are checked. A run against weak defenses may not say much about an upcoming match against a stronger side. That is why how much xG data is enough to trust depends partly on which matches produced it.
Open the match logs behind any striking figure. Did one penalty supply a large share of the xG? Did a red card leave an opponent defending with ten players? Those chances count, but the circumstances may not repeat. Even a steadier pattern can lose relevance when a key striker leaves, a defender returns, or a new coach changes the system.
Why xG figures differ
Two providers can assign different xG to the same shot because they use different event feeds or account for different details, such as defensive pressure and goalkeeper position. A team total of 1.42 from one source and 1.36 from another may reflect methodology rather than a meaningful difference in performance.
When choosing an xG statistics website, check its data coverage and how it handles penalties and missing matches. Compare teams and seasons within one provider rather than splicing figures from several. If an apparent betting edge rests on a few hundredths of xG, differences in the underlying data could erase it.
Testing
Does xG improve the bets?
A convincing xG angle needs a record made before kick-off, not a collection of matches where it would have worked. Save each probability estimate, the odds available at the time, the intended stake and the eventual result—even when the estimate produces no bet.
Compare it with something simple
Test against a baseline such as a basic team-form model or the probabilities implied by the available odds after removing the bookmaker’s margin. Keep a substantial later set of matches untouched while choosing the model and betting rules; adjusting them after seeing those results makes the apparent edge less credible.
Look beyond the return
Group forecasts into probability ranges and check whether outcomes occur about as often as predicted: bets rated near 60% should win roughly six times in ten over a large sample. Track profit at the recorded, obtainable odds after commission or fees, and compare those prices with closing odds. Regularly beating the close is encouraging, though it is not proof of profit, and a short profitable run may be luck.
Price the information too
Run the same test with free figures and a paid feed, changing as little else as possible. The difference between paid and free xG data matters financially only if it improves decisions enough to cover the subscription and any added work—not merely because its numbers look more precise.
A pre-bet rule for xG
The decision starts with a specific market, such as Over 2.5 goals—not a general view that one team was unlucky last week. Estimate that market’s probability from adjusted goal expectations, then write down a plausible range. If team news, a small sample, or a recent tactical change makes the estimate shaky, the range should be wider.
Next, convert the available odds to a break-even probability by dividing 1 by the decimal price. At 1.95, that is about 51.3%. A practical rule is to require the low end of the estimated range to clear break-even by a preset cushion, such as three percentage points. An Over 2.5 estimate of 57%, with a plausible range of 53%–60%, would therefore be a pass at 1.95: its cautious estimate is only 1.7 points above break-even.
The cushion is not a universal number; it is protection against model error and the bookmaker’s margin. Keeping it consistent makes bets easier to review later. If a probability cannot be estimated with reasonable confidence, there is no need to force a wager. xG is a reason to question a price, not an instruction to back every side that “should have scored.”
Conclusion
xG is useful evidence, not a betting signal on its own. It can explain why a result looks misleading and improve a match forecast. But if the same pattern is visible to the market, the odds may already account for it. A bet needs more than a plausible xG story: the estimated probability must beat the break-even rate in the quoted odds by enough to withstand the bookmaker’s margin and reasonable model error.
Before staking money, record proposed bets on paper, including the price available when each decision was made. Keep the passes too. Over a meaningful run of matches, that record can show whether the apparent edge survives real prices rather than hindsight.
Top Free Bets for October
BetUS
200% up to $1,000
18+. Full T&C's apply. Sports bonus: 100% match up to $500. Casino bonus: 100% match up to $500. Enter promo code NEW200 at deposit and get up to a $1000 bonus. Valid on your first three (3) deposits. Available for all deposit methods. Minimum deposit of $50.
18+. Full terms apply. The Bet Back Bonus is available for new customers on first-time deposits of $50 or more. To redeem, select the offer in the cashier while completing your first deposit. Make your pick(s) in the Sportsbook and then select ‘Opt In to Use Your Bonus’. A Bet Back Bonus pop-up will display, select ‘Claim’ and then enter the risk amount to place your bet. If it wins, you keep your profits. If it loses, get 100% of your risk refunded as Free Play with only 1-time rollover. Free Play can then be used to place bets in the Sportsbook and earn cash. Additional T&Cs apply, please visit MyBookie to access the Help Center or contact Live Chat for more details.
18+. Full T&C's apply. This promotion is available only to new accounts in North America. Freeplay amount must be wagered five times (5x rollover) before it becomes eligible for withdrawal. Only prematch (sportsbook) bets count toward the 5x rollover requirement. Each person may claim only one bonus. If a customer creates multiple accounts to exploit this promotion, bet105 will mark all related accounts as ineligible and reclaim the funds. If a client receives more than two free bets without making a deposit, any winnings from those bets will be forfeited. This promotion applies only to the initial deposit or if specifically assigned by bet105.
18+. Full terms apply. New BUSR members only. Minimum deposit of $50 required per qualifying deposits. Codes 300SB1, 300SB2, and 300SB3 must be entered at the time of each corresponding deposit.
Each code is valid one time only. Each bonus code must be claimed at least 24 hours apart. Only one promo code may be applied per deposit. A 20x rollover requirement applies to the combined total of your initial deposit and bonus before any withdrawal can be made. Redeemable in the Sportsbook only. BUSR management reserves the right to modify, suspend, or cancel this promotion at any time. Redeem each promo code in the cashier to get your bonus. Must be 18 or older. Please gamble responsibly. General House Rules Apply.
18+. Full terms apply. 100% up to $500 Bonus. Valid for non-crypto payment methods only. Minimum deposit amount $50. This offer is not available to customers from Canada or Mexico. The bonus code must be redeemed immediately after the deposit and before a wager has been placed. The sum of the deposit and the bonus are subject to rollover requirements of 12x at min. odds of -200 (1.5) before a new code can be redeemed. Max. $500 of each bet count towards the rollover requirements. Only bets placed on options that take place count towards the rollover requirements. Wagers on Horse Racing and Boosted Odds do not count towards the rollover requirements. All general Everygame Sportsbook rules apply.
21+. Full T&C's apply. Bonus: 35% of qualifying deposit, up to $105. Rollover: 8× (only sports action counts towards the rollover) deposit + bonus. Expiry: 7 days after credit. Hold period: 2 weeks. Payouts allowed only after rollover and hold period are completed. Example: Deposit $200 → Receive $50 Sports Free Play. Sports Free Play Rules: see the BetAnything General Reward Rules for eligible sports, wager types, odds, and rollover rules.
18+. Full T&C's apply. This bonus can only be redeemed on your first deposit. Rollover is 5x Sports/5x Horses/30x Casino on both the initial deposit and the bonus amount. Rollover in our Sportsbook, for winning wagers, will be determined by the lesser of your risk or win amount at the time of wager settlement; for losing wagers your risk amount will be credited to your rollover contribution. Bonus funds cannot be used for play on Live Dealer games. Live Dealer play does not count toward meeting Casino rollover requirements for withdrawal. If a withdrawal is made before the bonus terms are met, all bonus funds as well as any money earned by wagering the bonus will be forfeited.
Hi I'm Andy and I love to report on the latest football scores and Tables. I also like to have a bet on the football and occasionaly on the horses. On this website I have new bookmaker offers listed that will give you free bets and bonuses to help you beat the bookies. Enjoy your stay.