

BetOnline
$250 + 100 Free Spins
18+. Full T&C's apply.



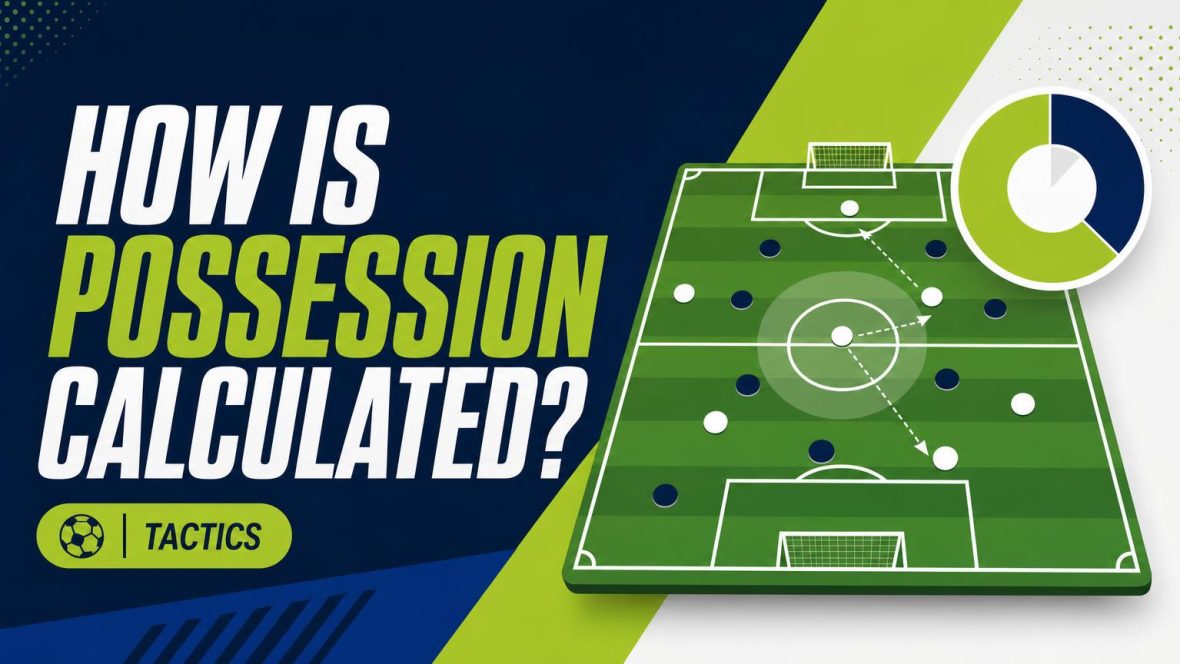
Possession is an estimate dressed up as a hard statistic.
A midfielder’s pass is blocked, the ball ricochets between two opponents, and both chase it toward the touchline. During those few seconds, who actually has possession? The match graphic still needs an answer—even when neither side has settled control.




Data providers apply rules to passes, touches and periods of control, often supported by tracking feeds. They must also decide how to treat tackles, deflections, loose balls and stoppages. Those choices vary, while some events are logged or corrected after a short delay. As a result, a 63%–37% split is not necessarily a literal stopwatch measurement. It is usually a rounded, method-dependent estimate—and the figure may shift slightly when the underlying data is reviewed.
Possession is a team’s share of measured control of the ball during a selected period, such as a half, a full match or a ten-minute spell. It does not mean every touch is credited. A ricochet, blocked clearance or brief contact during a tackle may be treated as contested play rather than controlled possession.
A time-based calculation can be expressed simply:
Team possession time ÷ total measured possession time × 100
The denominator matters. Some systems divide by the time either side controls the ball, excluding stoppages and uncertain phases. Others use more of the match clock, while event-based models may infer possession from passes and sequences rather than timing control second by second.
That is why possession figures can differ between data providers even for the same match. Each provider sets rules for when control starts, when it ends and how loose balls, duels and dead-ball periods are handled. Possession therefore has no single universal standard; it is best read as a consistent estimate within one provider’s method.
The basic calculation is:
Team possession % = team possession time ÷ combined assigned possession time × 100
Suppose Team A is credited with 31 minutes 20 seconds and Team B with 26 minutes 40 seconds. Their combined assigned time is 58 minutes, so the calculation gives:
This process is called normalization. Although 60 minutes may have elapsed at that point, the two percentages are based on the 58 minutes assigned to a team, making them add up to 100%.
The missing two minutes might contain stoppages, disputed control, loose-ball sequences or moments the provider leaves unassigned. Another provider may allocate some of that time to whichever team it judges to be in control, producing slightly different figures from the same match.
Published numbers are usually rounded to whole numbers or one decimal place. As a result, recalculating from displayed possession times can produce a difference of around 0.1 percentage points. Totals may also occasionally appear as 99.9% or 100.1% when separately reported values or additional categories are rounded.
There is no single instrument that measures possession. The method depends on the competition, data provider and technology available, as explained more broadly in this guide to football possession and passing statistics.
An observer can operate a timer for each team, switching it whenever control changes. This approach measures possession time fairly directly, but borderline moments require human judgment: a deflection, loose ball or contested header may not produce an obvious handover.
Many systems record events such as passes, tackles, interceptions and shots with precise timestamps. Software then assigns the intervals between events according to provider rules. It may also use passes, touches or event counts as proxies—convenient indicators of involvement, but not literal measurements of how many seconds a side controlled the ball.
A team making several quick passes could register many events in a short spell, while a goalkeeper holding the ball might create few. That is why a pass-share calculation and a time-based figure can differ noticeably.
Camera-based tracking follows the ball and players continuously, while electronic systems can use sensors or highly detailed positional feeds. These methods provide finer timing, but algorithms must still decide when control begins, ends or becomes contested. Technology reduces gaps; it does not remove interpretation.
The possession graphic shown on television is normally supplied by a league partner, analytics company or broadcaster’s data service. Referees do not calculate or certify it, and it has no direct role in match decisions.
After a pass or touch, possession usually remains with the same team while the ball travels, provided the action appears deliberate and a teammate is the intended recipient.
During tackles, ricochets and 50–50 duels, control may stay with the previous team until an opponent makes a controlled action. Some systems instead mark that interval as neutral or unassigned.
A slight defensive touch often does not create new possession. An interception, controlled clearance or purposeful header may trigger a switch, although providers set the threshold differently.
A bouncing ball after a clearance may be credited to the clearing team, left unassigned, or linked to whichever side next controls it. Long aerial duels create similar judgement calls.
Once the ball goes out, providers may stop the clock, retain possession for the team awarded the restart, or wait for play to resume. Fouls, injuries, substitutions and other stoppages can also be excluded or assigned under different conventions.
There is no perfectly precise answer for every transition. A consistently applied rule set makes comparisons more dependable than second-by-second certainty.
Team A controls the ball for 27 minutes and Team B for 18 minutes. The assigned possession time is therefore 45 minutes, not necessarily the full elapsed match time.
A pass-based estimate can produce a different result. If Team A makes 240 of the teams’ combined 450 completed passes, its estimated share is 53.3%, leaving Team B with 46.7%. The gap arises because passes are only a proxy: long carries, dribbles and controlled periods without a pass add time but not pass events.
First- and second-half percentages should be rebuilt from their underlying times. Suppose the first half produces the 27–18 split above, while the second has Team A controlling 12 minutes and Team B 18 minutes:
Blindly averaging Team A’s half-by-half figures—60% and 40%—would give 50%. That is wrong because the halves contain different amounts of assigned possession time: 45 minutes in the first and 30 in the second. Raw times, passes or event counts must be added first; the final percentage comes afterward.
Early in a match, each possession represents a large share of the limited playing time recorded. A single two-minute spell can therefore move the display by several percentage points. Later, the same spell has much less influence because it is absorbed into a larger sample.
Live graphics also reflect an unfinished data feed. Events may reach the provider seconds late, especially during rapid exchanges, while the broadcaster may update its graphic only at fixed intervals. This helps explain apparent jumps and is central to judging the reliability of live possession statistics.
Providers can revise the underlying match timeline when reviewing the feed. Typical adjustments include:
Automated checks may flag gaps or sequences that conflict with other match data. Human operators can then review the incident, while post-match quality checks reconcile event logs, tracking information and control periods.
For that reason, the official post-match percentage may differ slightly from the final broadcast graphic. The screen figure may be rounded, delayed or based on data captured before the last corrections. Small differences are normal; a large discrepancy more often suggests different providers or calculation rules.
Possession shows control of the ball, not how productively it was used.
A side can dominate the percentage through slow circulation between defenders while creating little. Shots, entries into dangerous areas and chance quality provide essential context.
A team protecting a lead may deliberately concede the ball and defend compactly.
Understanding how the scoreline affects possession explains many apparent reversals. The trailing side often pushes higher and passes more, while the leader prioritizes space, shape and counterattacks.
Possession says nothing about where that control occurred.
Sixty percent accumulated near the halfway line is different from sustained control around the penalty area. Field position and the ability to progress the ball determine whether possession applies pressure.
Direct or counterattacking teams may willingly trade possession for space and clearer chances.
A few fast attacks can produce better shots than dozens of safe passes. Comparing shot volume, expected goals or other chance-quality measures helps reveal which team created the stronger opportunities.
Different data companies and broadcasters may apply different rules, so figures from separate sources are not automatically comparable.
Look for timed control, event-based inference or tracking data. If the method is undisclosed, treat apparent precision cautiously.
Distinguish live, first-half and full-match figures. Never average two half percentages without their underlying control totals.
Live numbers may change after delayed events, disputed phases and data errors are reviewed.
Set ball share beside shots, expected goals, box entries and field position. High possession may reflect pressure, harmless circulation or game-state effects.
Possession is best read as a provider-defined estimate of measured control, not a universal stopwatch record. A percentage becomes meaningful only when its source, method, time window and revision status are clear—and when attacking outcomes show what that control produced.

A common version uses completed passes in each team’s attacking third: Team A field tilt…
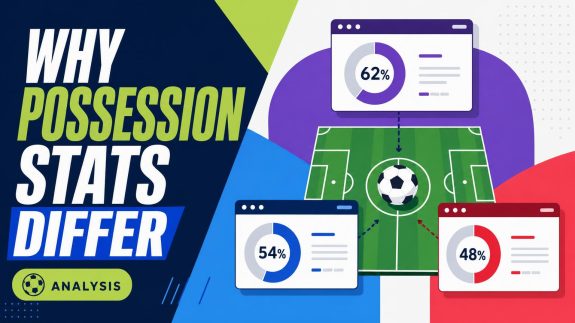
Most published figures come from one of three approaches to [nodelink id="fbdb9180-aaaf-4178-af1f-4d02d55321b5"]calculating football possession[/nodelink]: event…
