BetOnline
$250 + 100 Free Spins
18+. Full T&C's apply.




A passing percentage is only as impressive as the job those passes were meant to do.
A centre-back can complete 92% by circulating the ball across the back line, while a playmaker may finish at 76% after repeatedly attempting defence-splitting passes. The first figure suggests security; the second could create far more value.




As a loose benchmark, around 80–90% is usually respectable, but role and difficulty matter more than the headline number. Tactical style also changes expectations: possession-heavy teams create easier passing options, whereas direct sides accept more turnovers. Match context matters too. Protecting a lead often encourages safe distribution, while chasing a goal demands risk. An 85% rate is genuinely good when it combines reliability with passes that advance play—not when accuracy is achieved by avoiding useful options.
Around 75–85% is a useful broad benchmark. Possession-heavy elite teams may exceed 85%, while direct teams or sides facing strong pressure can perform effectively below 75%.
Central defenders often record 85–95%, and midfielders commonly sit around 80–90%. Wingers and strikers may post 65–80% because they attempt more crosses, through balls, and passes near goal.
Divide completed passes by attempted passes, then multiply by 100. Completing 42 of 50 attempts produces an 84% rate—a useful starting point when reading football passing statistics for beginners.
Yes. Faster games, stronger pressing, poorer pitches, and larger differences in team quality can all shift the typical range, so comparisons work best within the same league and season.
Not always. Providers may classify crosses, deflections, goalkeeper throws, blocked passes, or clearances differently, creating small but meaningful discrepancies.
A one- or two-point difference may reflect data definitions rather than performance. Use the same provider when comparing players, teams, or seasons, and treat role and pass difficulty as essential context.
Why do central defenders usually post high completion rates?
Central defenders often complete roughly 85–95% because many exchanges are short and face limited pressure. Progressive passes into midfield or long diagonals add risk, so direction matters alongside the headline figure.
What is typical for midfielders and creators?
Deep midfielders commonly sit around 85–92%, recycling possession while occasionally breaking lines. Creators may fall near 75–85% because through balls, crowded areas, and quick combinations fail more often.
How do full-backs and wingers compare?
Full-backs often land around 75–88%; safe buildup passes lift the figure, while crosses and balls down the line lower it. Wingers may sit around 70–82% because they frequently attack space or attempt decisive passes.
What rates are common for goalkeepers and forwards?
Goalkeepers may range from 65–90%, largely depending on short buildup versus long distribution. Forwards often record 65–80% because layoffs arrive under pressure and final-third passes allow little margin.
Use these ranges as rough guides, not grades. A 78% winger creating chances may be more effective than a 90% defender making mostly safe passes; comparisons work best between players with similar roles and tactical instructions.
A possession-heavy side often builds through short, low-risk passes between defenders and midfielders. That approach usually produces a higher completion rate, although much of the circulation may occur away from the opponent’s goal.
Direct and counterattacking teams accept a different trade-off. Long diagonals, early balls behind the defence, and fast forward passes are harder to complete, but one success can bypass several opponents and create a clear chance. An 80% rate may therefore support the plan better than 90% built largely on safe passes.
This is why assessing a team’s passing directness adds useful context. Accuracy should be considered alongside:
Lower accuracy is not automatically poor execution; it may reflect deliberate ambition.
Yes. A midfielder can complete ten short or backward passes under little pressure and finish with a perfect record without moving the attack forward. Another may complete seven of ten because several attempts split lines or find runners near goal; the lower percentage can still reflect greater attacking value.
The whole possession often tells the clearer story. Consider two sequences:
Sequence A adds several completions to individual totals but achieves little. Sequence B contains more danger even if its final pass sometimes fails. Looking at passes within each possession helps show whether accurate distribution advances play, manipulates pressure, or merely retains the ball.
Useful context includes pass direction, distance, pressure, starting location, and the outcome of the possession. Completion rate describes security; it does not measure purpose on its own.
High accuracy may reflect low-risk passes rather than exceptional execution.
Pressure, field position and intent matter. Recycling possession among defenders is easier than breaking lines near a crowded penalty area—one reason pass completion can give a misleading impression.
A single game is too sensitive to tactics and circumstances.
An early lead may encourage safe possession; chasing the score can force ambitious passes. Opponent pressure, set pieces and a small number of attempts can also distort the result.
Providers may classify passes and unsuccessful actions differently.
Throw-ins, crosses, blocked passes, deflections and goalkeeper distributions may be included or excluded under different rules. Even small definition changes can alter the published rate.
Before comparing percentages, check the provider, competition, position, match sample and pass types included. Context usually explains small differences better than supposed inconsistency.
Benchmark centre-backs against centre-backs, not playmakers whose passes carry different risks.
Prefer several matches or a full season; one difficult fixture can distort the rate.
Check average distance, long-pass volume, crosses, and passes under pressure.
Pair accuracy with progressive passes, chances created, territory gained, and costly turnovers.
Use one reliable provider and note whether crosses, throw-ins, or other actions are classified differently.
No universal percentage defines good passing. The best completion rate supports the player’s role and tactical purpose while delivering enough progression or creation without excessive harmful turnovers.

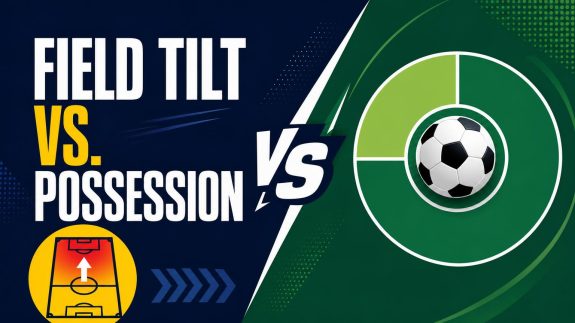
A common version uses completed passes in each team’s attacking third: Team A field tilt…