

BetOnline
$250 + 100 Free Spins
18+. Full T&C's apply.



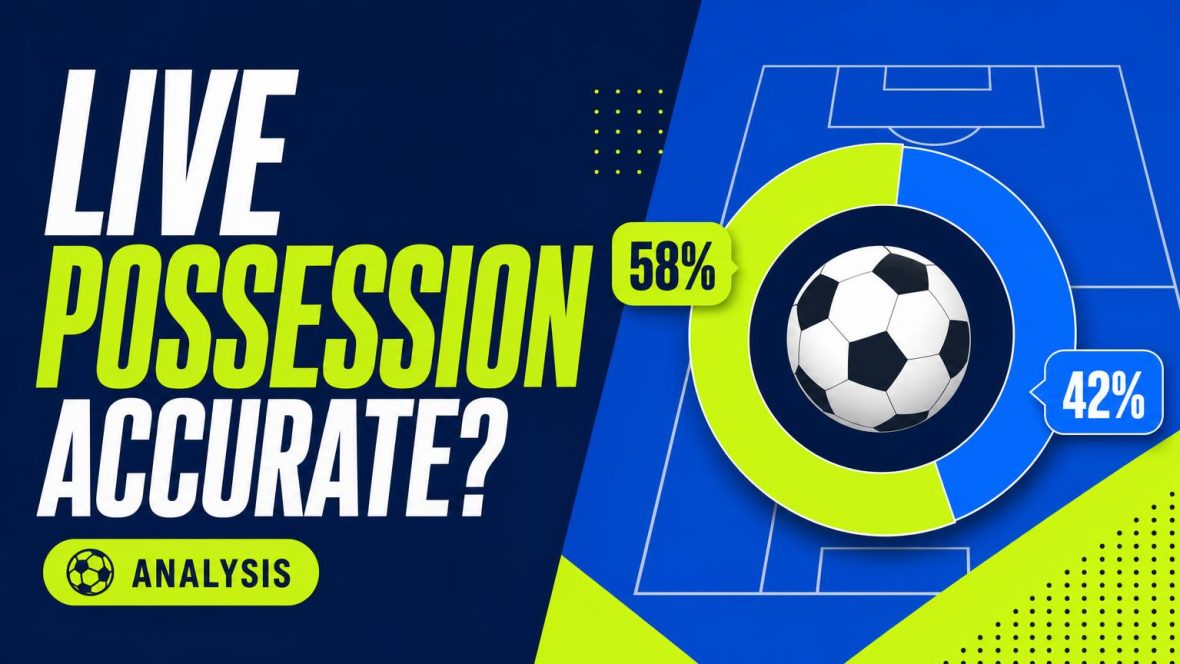
A confident percentage can hide a surprisingly messy measurement.
One side can pin the other inside its own half for ten minutes, yet the display suddenly shifts from 68% to 61%. Open two apps showing live possession statistics, and the figures may disagree as well. That is frustrating, but it does not necessarily mean either feed is broken.




Live possession is provisional. Providers may use different event feeds, update intervals, and rules for deciding when control begins or ends. Late corrections can also make percentages jump rather than move smoothly. Numerical accuracy is only half the issue: possession measures control of the ball, not territorial pressure, attacking intent, or danger. A team exchanging safe passes near its own penalty area may dominate the count while looking second best. The figure is therefore best treated as an estimate of ball control—not a complete verdict on the match.
A period when the provider identifies one team as having clear command of the ball, usually from recorded touches or events.
A loose ball, aerial duel, tackle, or scramble in which neither side has settled control. It may be excluded or assigned according to provider rules.
Time used for injuries, substitutions, disciplinary action, or restarts. Some systems pause the possession clock; others retain the last known team in control.
The interval after the ball crosses a boundary and before the restart. This is commonly excluded, but treatment is not identical across feeds.
Live possession usually gives a reliable broad picture of which team has seen more of the ball. A 65–35 reading after a substantial period probably reflects a genuine imbalance. A 51–49 split, however, should not be treated as a precise or meaningful distinction.
The reason is that “possession” is not simply the whole match clock divided between two teams. Providers must decide when control begins and ends, how to handle a deflection or duel, and whether dead-ball time counts. The method used to calculate possession percentages therefore affects the result even when every recorded event is correct.
A short spell has an outsized effect near the start. If one side circulates the ball for 40 seconds during the opening two minutes, it can shift the percentage dramatically; the same sequence barely changes the figure late in the match. Early values are best read as a snapshot, not an established pattern.
Live feeds add another source of uncertainty. A delayed event, temporary connection problem, or incorrectly assigned touch can freeze the display or push it several points in one direction. Once the missing data arrives, the percentage may jump or be corrected without any unusual passage of play occurring.
A practical reading is to focus on ranges and direction:
Possession can describe the balance of ball control well, but individual percentage points are rarely definitive in real time.
Do websites use the same possession supplier?
Not always. A site may receive events from an in-stadium operator, a tracking system, or another data company, and each feed can classify the same sequence differently.
Can calculation rules change the percentage?
Yes. Suppliers may handle contested touches, clearances, stoppages, and periods when neither team controls the ball differently. These choices alter the totals without involving an obvious mistake.
Why do figures change at different times?
Services refresh at different intervals, while transmission and processing add latency. This helps explain why websites can show different possession numbers during the same passage of play, even if their figures later converge.
Do rounding and the match clock matter?
A raw figure such as 54.6% may appear as 55%, 54.6%, or occasionally 54%, depending on rounding rules. Providers may also pause, estimate, or synchronize possession against the official clock differently during stoppages.
Small live gaps are usually more informative about method and timing than accuracy. A source becomes more questionable when its number freezes, moves implausibly, or remains far from several other feeds after the match.
A pass, touch, duel, clearance, or stoppage is logged with a timestamp and team assignment. The possession calculation updates from that provisional record.
The provider may update immediately, while an app or broadcaster refreshes seconds later. A brief frozen percentage is usually display latency, not a statistical correction.
Automated checks and human reviewers compare the entry with nearby events, later feed data, or video. Ambiguous touches and rapid turnovers are common review points.
An event may be reclassified, assigned to the other team, inserted if it was missed, or removed as a duplicate. Its timestamp can also be adjusted.
The corrected event sequence can change both teams’ percentages, sometimes several minutes after the incident. Small revisions are normal quality control, particularly during fast or contested play.
A correction may alter earlier match minutes as well as the current reading.
Occasional one- or two-point adjustments are not usually concerning. Repeated large jumps, long freezes, impossible totals, or figures that repeatedly reverse without match events may indicate a delayed, incomplete, or unstable data feed rather than routine review.
Possession shows how playing time was divided, but not whether that time produced effective football. The broader explanation of possession and passing statistics helps distinguish ball retention from genuine control.
A useful reading also considers territory, shots, chance quality, score state, and passing patterns. A team protecting a lead may willingly concede the ball; another may dominate possession while creating little. The percentage becomes informative when it supports the match story—not when it is asked to tell that story alone.

Most published figures come from one of three approaches to [nodelink id="fbdb9180-aaaf-4178-af1f-4d02d55321b5"]calculating football possession[/nodelink]: event…
A compact defense does not try to contest every pass. It may concede exchanges between…
