

BetOnline
$250 + 100 Free Spins
18+. Full T&C's apply.



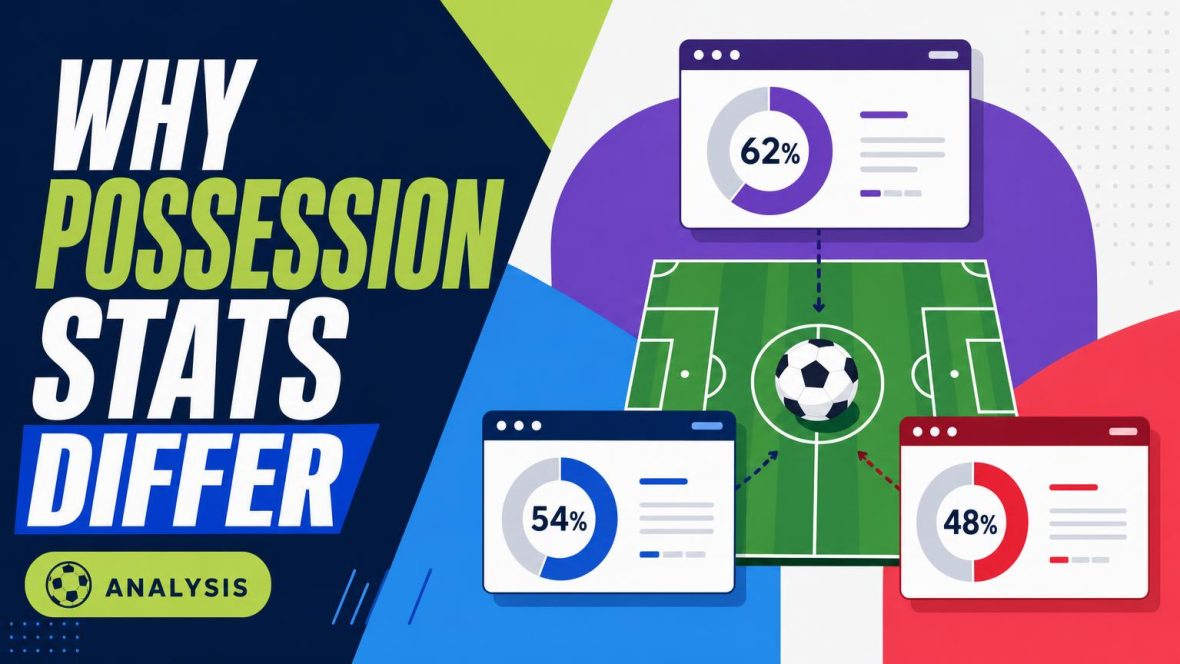
Possession looks precise, but the number depends on what counts as control.
At the final whistle, one reputable site may report 54–46 possession while another shows 51–49 for the same match. That can look like a data error, especially when both percentages are presented without explanation.




Usually, however, the disagreement comes from different measurement rules. One provider may estimate the time each team controlled the ball; another may infer possession from passes, touches, or logged events. Loose balls, contested duels, stoppages, missing events, later feed corrections, and rounding can all shift the result. A large discrepancy may deserve scrutiny, but a gap of a few percentage points often means both figures are consistent with their own methodology—not that one website simply got the match wrong.
Possession estimates which team controls the ball over time. It is a model built from match events and timing rules, not a direct sensor reading or a separate official clock.
Pass counts record actions, not duration. A team can complete many quick passes yet hold the ball for less time than a side taking longer between actions.
Territory describes where play occurs. The principles behind understanding football possession figures also explain why a team may control the ball mainly in its own half without gaining territorial advantage.
Pressure concerns how aggressively a team challenges the opponent. A side can press intensely while recording little possession because pressing happens when the other team has the ball.
Attacking dominance is better reflected by chances, shots, box entries, or expected goals. High possession can support attacks, but it can also consist of slow, low-risk circulation far from goal.
Most published figures come from one of three approaches to calculating football possession: event timing, event-count proxies, or tracking data. They often agree on the broad shape of a match, but not on every second.
Suppose Team A completes a pass at 20:00. Team B tackles at 20:04, the ball rolls loose until 20:07, and Team A then wins a throw-in. Play restarts at 20:15.
A previous-event model may give Team A the first four seconds, then credit Team B from the tackle until the throw-in. A later-event model could assign the three-second loose-ball interval to Team A because its throw-in is the next recorded action. Another system may label 20:04–20:07 as contested, excluding it from either team’s total.
The eight seconds before the restart create another split. Some providers stop the possession clock when the ball leaves play; others retain possession for Team A because it has the restart. Across dozens of tackles, deflections, fouls, and throw-ins, these small decisions accumulate into visibly different percentages—even when every provider uses the same match events.
A clean passing sequence is easy to assign. A tackle that sends the ball bouncing between three players is not. During those seconds, one model may retain possession for the previous team, another may switch it at the tackle, and a third may wait for a controlled touch.
Common grey areas include:
Providers also differ on when possession should be withheld altogether. Some place genuinely loose-ball time into a neutral category internally; others allocate it to the last team in control or the team that eventually wins the ball.
Each decision usually affects only a second or two. Repeated across midfield scraps, rebounds and counterattacks over 90 minutes, however, those tiny allocations accumulate. Two providers can therefore interpret the same match faithfully while reporting different possession shares.
No collection workflow creates a perfectly neutral record of a match. Each turns continuous play into discrete events, with small judgement calls built into the process.
A timestamp may mark the first touch, the release of a pass, or the moment an operator clicks. Even a fraction of a second matters when thousands of intervals are added together.
Quality-control procedures also vary. Some providers revise records after full-time; others publish near-live figures with fewer later changes. Comparisons such as how Opta and StatsBomb define possession therefore reflect different event definitions and models, not simply different levels of accuracy. Without access to those internal rules, small disagreements are usually expected rather than evidence that one feed is wrong.
A possession percentage is a duration divided by a chosen total. That total may be all elapsed match time, time when the ball is in play, or only time assigned to either team.
Consider a side credited with 2,700 seconds of control:
| Denominator used | Calculation | Possession |
|---|---|---|
| 5,000 assigned seconds | 2,700 ÷ 5,000 | 54.0% |
| 5,400 in-play seconds | 2,700 ÷ 5,400 | 50.0% |
| 5,760 elapsed seconds | 2,700 ÷ 5,760 | 46.9% |
The credited possession duration is identical in every row. Only the denominator changes.
Dead balls create much of the difference. Some systems stop counting for throw-ins, goal kicks, injuries, substitutions, and VAR checks; others carry the previous team’s control until play restarts. Loose or disputed intervals may be excluded, marked as unassigned, or attributed to one side.
Added time also matters. A provider may use the referee’s recorded period length, the final event timestamp, or a fixed 45-minute boundary. Actions near half-time and full-time can therefore be clipped or retained differently.
This is why two percentages can disagree even when the underlying credited control is similar. It also explains why some displays sum neatly to 100%, while others may leave a small unassigned share.
During a match, possession is calculated from the information available at that moment. An event may reach the feed several seconds late because of transmission lag, a difficult sequence, or a manual operator catching up. Until it arrives, the model may temporarily credit too much time to one team.
Providers also revise events already logged. A touch first marked as a completed pass might become a deflection; a duel may be moved to a more accurate timestamp; an apparent turnover may be reclassified as continued control. Because possession is cumulative, even small edits can alter earlier percentages and every figure that follows.
This is why the reliability of live possession figures depends partly on their purpose. A live display is a fast, provisional estimate designed to follow the match. Post-match data has usually passed through automated checks, operator review, or reconciliation with fuller event and tracking records.
For fair comparisons, figures should be taken from the same provider and the same publication stage—preferably the validated post-match record. Routine revisions do not make possession meaningless; they show that speed and verification involve a trade-off. Large or unexplained changes deserve scrutiny, but a one-point adjustment is often normal data cleaning.
Confirm that both figures cover the same window: first half, second half, extra time, or the full match. Some pages also include stoppage time differently.
A live estimate may lag behind play or await event validation. Compare it with another live page, or wait for the post-match update before treating the gap as settled.
Look for a supplier credit in the page footer, statistics panel, or site documentation. Matching providers should usually agree more closely than unrelated feeds.
Whole percentages can hide decimal differences and may not add to exactly 100%. A 51–49 display may represent several slightly different underlying values.
A difference of one or two percentage points is rarely meaningful on its own. Larger gaps that remain after the final whistle are more likely to reflect different methods or corrected source data.
Screenshots and timestamps help when comparing figures that may later be revised.
Possession is best treated as a broad indicator of control, not a perfectly standardized match fact. Small discrepancies often say more about timing, definitions, and presentation than about what happened on the pitch.
Read the percentage alongside shots, territory, and the sequence of match events. Together, those measures provide a more dependable picture of how the game unfolded.

A possession figure looks precise, but it is not governed by one universal method. The…
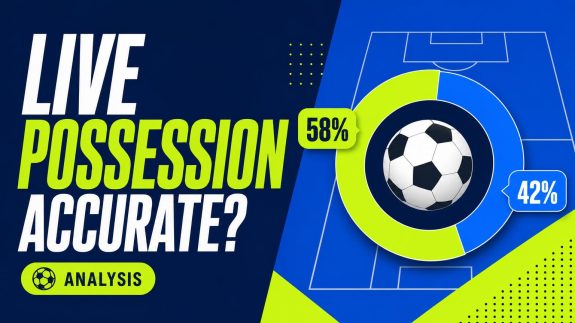
Live possession usually gives a reliable broad picture of which team has seen more of…
